iTools


Students can create their own graph.
Click on the Activities drop down arrow (see picture below)
to select the kind of graph you wish to create.


Lesson 9.1
Take a Survey
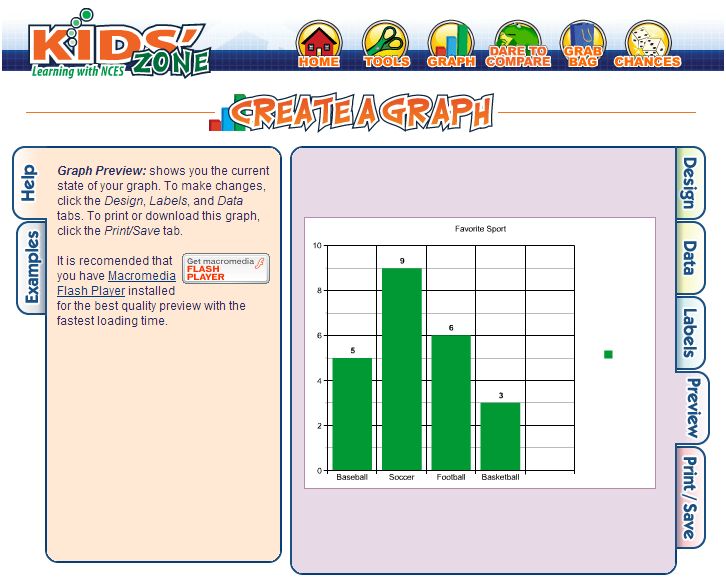
Students can create their own bar graph.
The columns and rows can be adjusted and students can type in their own title and label columns.
Possible graphs: Have your child poll members of the family
to find their favorite pizza toppings, ice cream flavors, sports, etc.
Enter this data onto the bar graph.
OR
OR
Students can graph items of which that they have collections;
for ex., graph how many balls (soccer, baseball, etc.),
or how many pets, shoes (sneakers, cleats, sandals, boots)


Lesson 9.4
Make a Bar Graph

(NCES site)

Lesson 9.5
Pictographs

